Bio Informatics
16S rRNA Microbiome Analysis Support
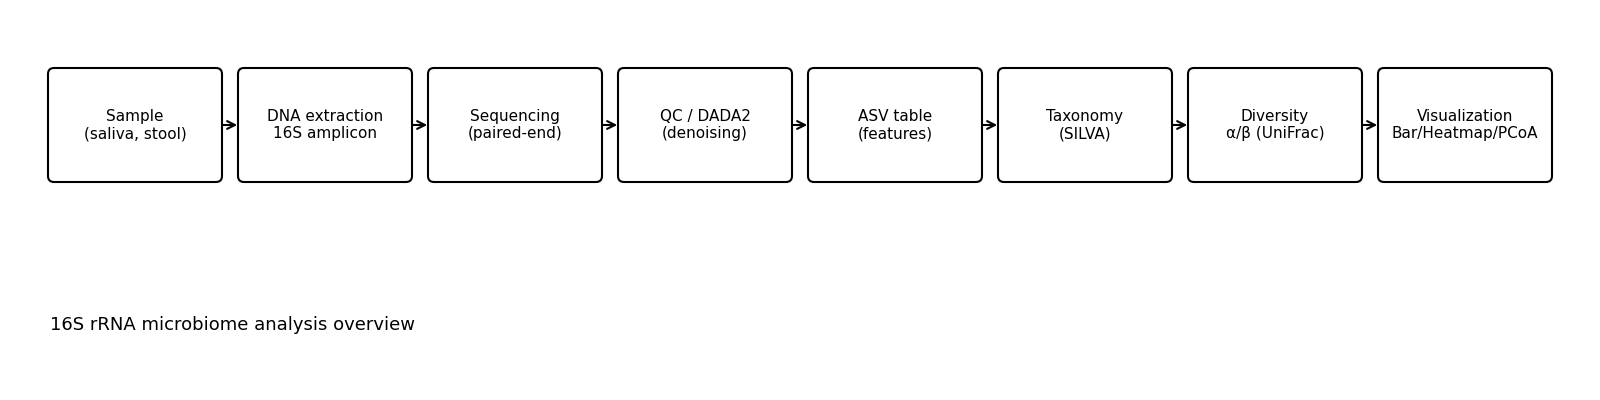
We provide a comprehensive service from pipeline construction using Qiime2/DADA2/SILVA to quality control, taxonomy assignment, α/β diversity analysis, and visualization.
- Examples of applicable samples: Saliva, stool, environmental samples, etc., capable of batch analysis of 400 samples
- Requirements definition → Analysis environment construction → Pipelining → Report/reproduction procedure
Key points of reference research (Japanese summary)
In Alzheimer’s disease (AD) model mice, a decrease in gut microbiota diversity, an increase in the Firmicutes/Bacteroidetes ratio, and translocation of bacteria to the pancreas and other organs were observed.
Dietary supplementation with L-arginine and limonoids improved the diversity of the gut microbiota and tended to suppress inflammation, oxidative stress, and neurodegeneration in the liver, pancreas, and brain.
This research suggests that gut-pancreas-liver-brain interactions may be involved in AD pathology, supporting the hypothesis that correcting the gut environment may help slow the progression of neurodegeneration.
(Source: Minamisawa et al., 2021; PubMed/MDPI)
For details, please refer to the original paper.
- PubMed Abstract: Minamisawa M. et al., Life 12(1):34, 2021.
- MDPI article page (JS required): Life 12(1):34.
Implementation details
environment construction
- Selection and assembly of analysis hardware
- Building Python/Anaconda on Linux
- Creating a Qiime2 pipeline
Quality control and pretreatment
- FASTQ (paired-end) quality check by DADA2
- Cropping/Filtering/Denoising
- High-quality ASV table creation
Annotation and analysis
- SILVA DB construction and reference settings
- Taxonomy assignment
- α/β diversity analysis (Shannon, Faith PD / UniFrac, etc.)
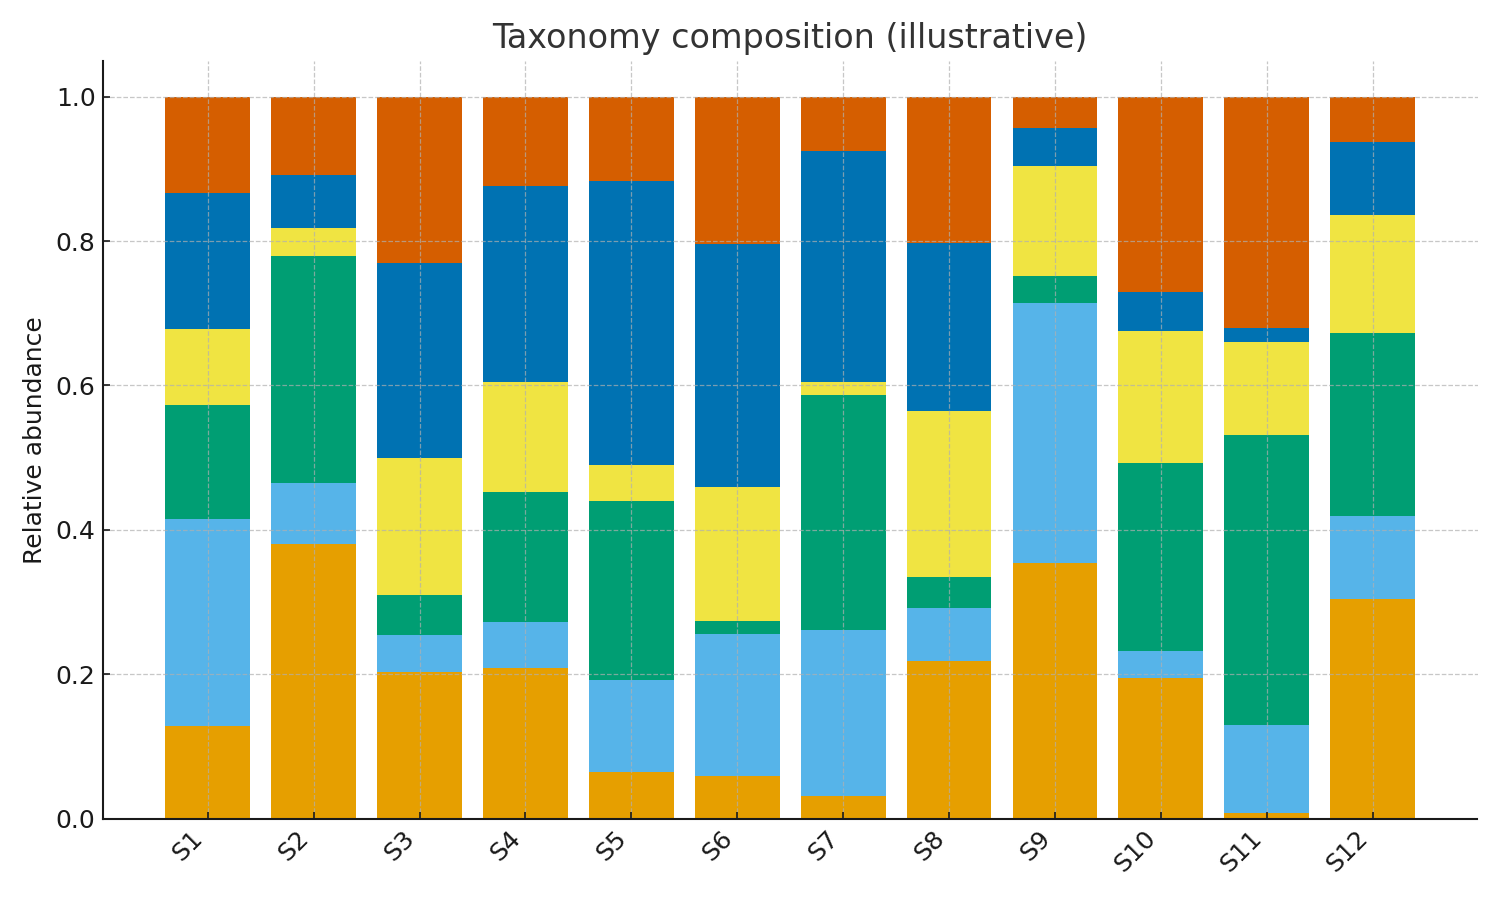
visualization
- taxonomy-bar-plot
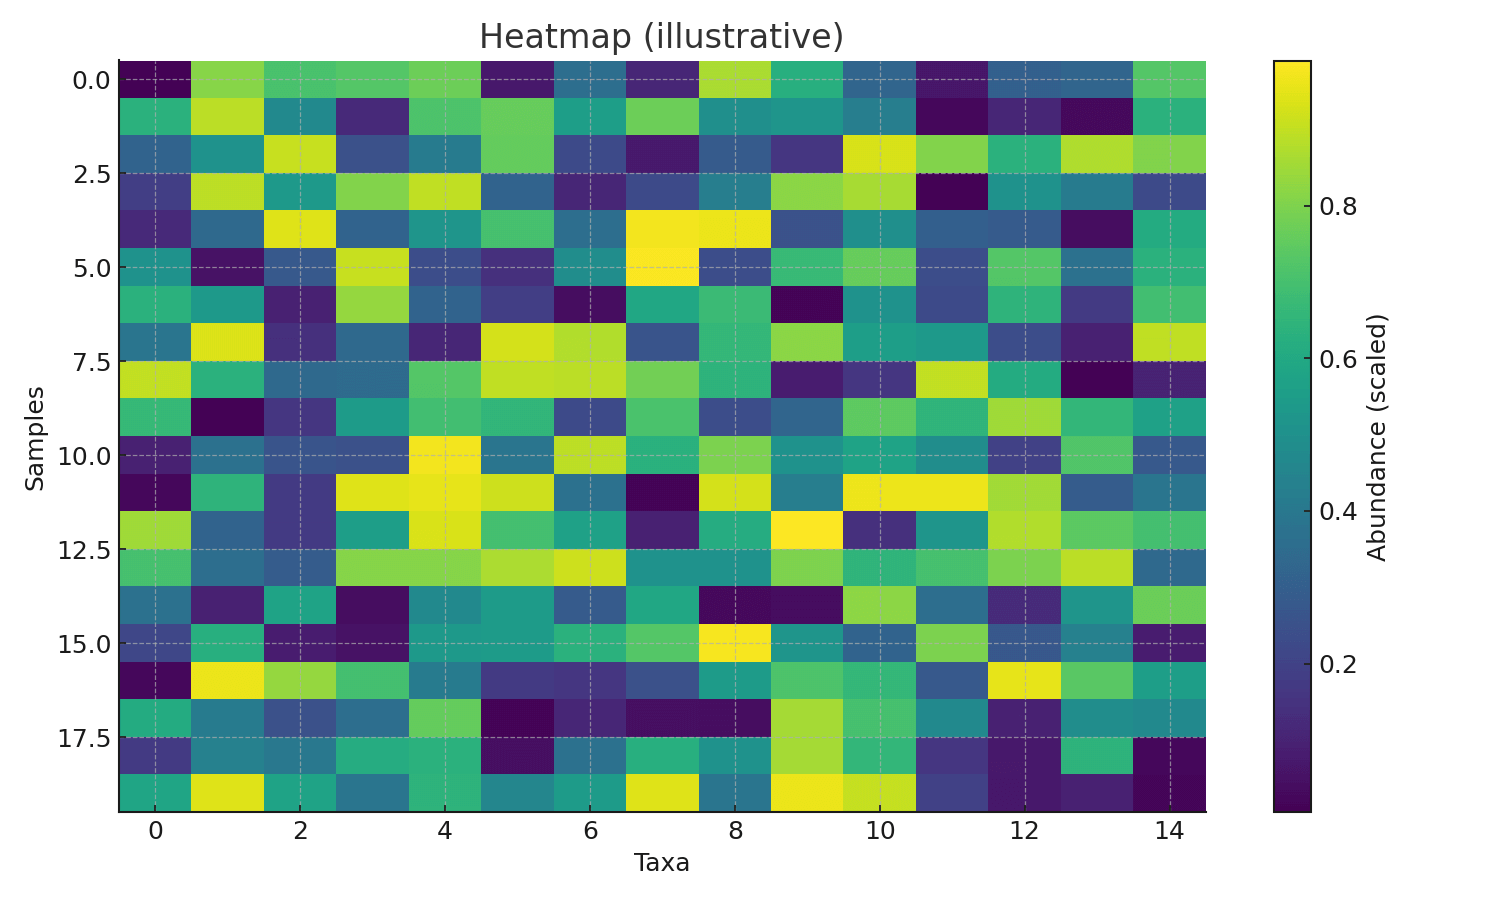
- Heat map (relative abundance and indicator bacteria)
- Principal coordinate analysis (PCoA)
Reproducibility and transferability
- Steps to reproduce fixed parameter version
- Semi-automation using Snakemake/shell etc. (optional)
- Proposal for recalculating results/comparing differences
Report
- Clarification of analysis policy/preprocessing conditions
- Interpretation of statistical tests and visualizations
- Proposal for next action (hypothesis → additional analysis)
Strengths
- On a scale of 400 samples , parameters were optimized stepwise while observing the results , and repeated analysis was carried out from different angles.
- We provide more exploratory and flexible analysis than general contract services (going back and forth between hypothesis testing and visualization).
- We provide comprehensive support from requirements definition to environment and pipeline construction and reporting .
Representative deliverables (examples)
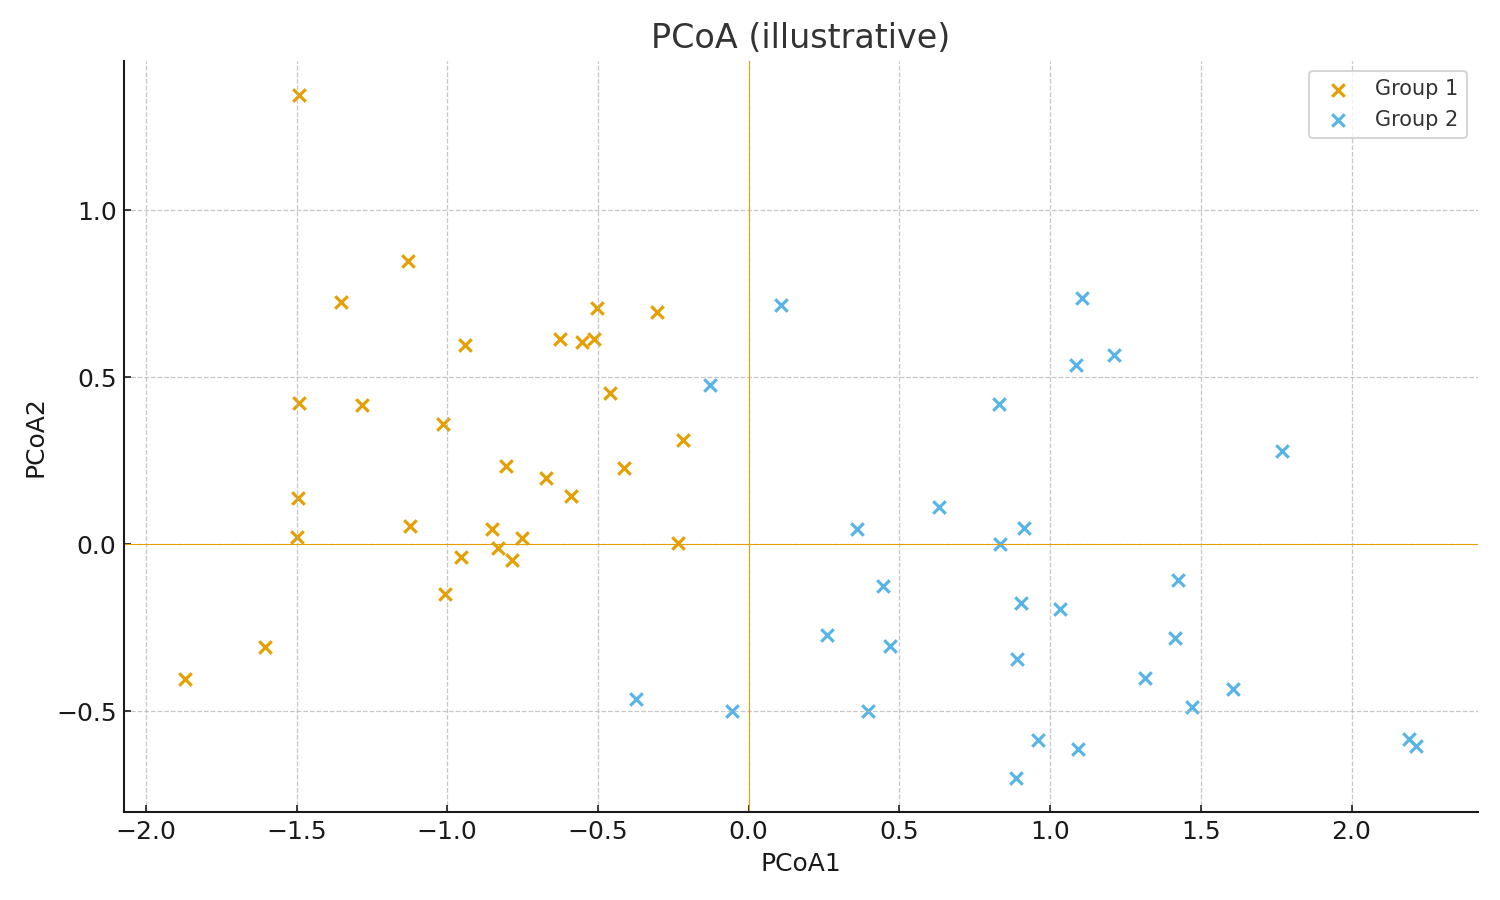 PCoA (UniFrac distance)
How to proceed
- Requirements hearing : Objectives, hypotheses, and benchmark definition
- Environment and data reception : Determine metadata format/naming rules
- Pretreatment/QC : Tentative determination of DADA2 conditions → Small-scale test
- Main analysis : taxonomy, diversity, visualization, statistics
- Report : Result interpretation, parameters/reproduction steps, next actions
inquiry
Let us know your requirements and data situation, and we’ll propose the appropriate scope and implementation plan.